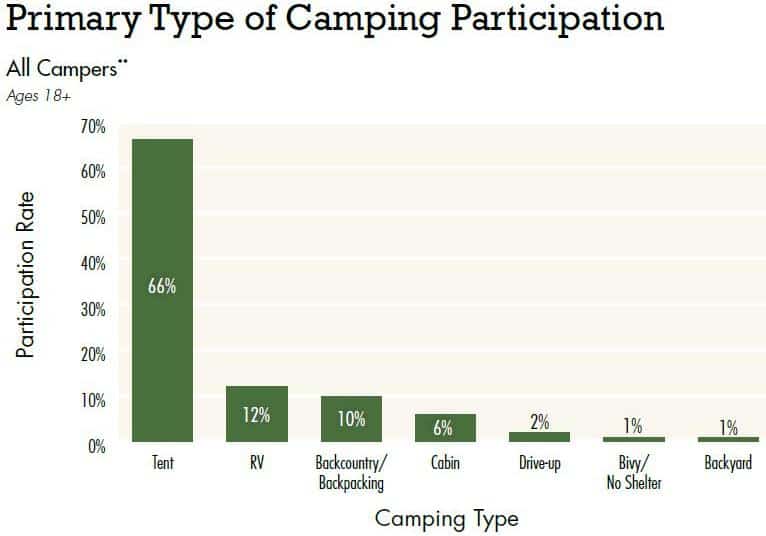
The 2012 American Camper Report provides detailed data and analysis on camping trends throughout the United States. The report presents information on overall participation, preferences, buying behavior and the future of camping.
The report makes a broad definition of camping to include everything from ‘Glam Cabin Camping’ to sleeping overnight in the backyard with your kids, but it has some interesting date none-the-less.
The report, funded by KOA and Coleman, shows that camping participation is growing. In 2011, 42.5 million Americans – or 14.9 percent of the US population over age six – went camping. This participation rate is up from 39.9 million, or 14.1 percent of the population, in 2010. Whether roughing it in a tent or enjoying a luxury cabin, campers spent an impressive 534.9 million days camping, an average of 12.6 days per person.
On a “typical” camping trip
- Campers average 5.5 camping trips per year. Public campgrounds are the most popular camping venue, and within that category, state parks rank as the favorite destination. To get to their chosen destination, campers travel an average of 190.6 miles and usually stay for one or two nights.
- Although almost half of campers make the decision to go camping at least a month in advance, many campers do not make campsite reservations until the day of the camp. Thirty-five percent say they made a walk-in reservation on their last trip.
- A large majority of camping trips — 70 percent — are taken with friends. The younger age bracket is especially social, with 80 percent camping with friends. Hiking is, by far, the favorite activity to participate in while camping. Not only is the activity accessible to all ages, it requires little gear and allows campers to explore their surroundings.
Key findings include:
- Almost 43 million Americans went camping in 2011 for a total of 534.9 million days. Participation is up from 39.9 million campers and 514.8 million days in 2010. lmost all age brackets added participants, except the adolescent group.
- Camping gained a net of 2.6 million participants from 2010 to 2011, but it has a fairly high churn rate at 16 percent.
- Reports from public and private campsites and the Outdoor Industry Association illustrate a general uptick in camping participation.
- The Mountain Region has the highest camping participation rate.
- Seventy-seven percent of all campers are married or living with a domestic partner.
- Eighty-four percent of campers participate in multiple outdoor activities.
- Profile of a Camping Trip
- Sixty-seven percent of participants camped the most in public campgrounds.
- The average camper went on 4.97 camping trips.
- Participants traveled a mean of 190.6 miles away from home to camp.
- Almost half of all American campers plan their trips at least one month in advance.
- Seventy percent of all trips are taken with friends.
- Fathers are the most likely person to take someone camping for the first time.
- The most cited reason for reducing the number of camping trips are a lack of time due to work and family commitments
View the full report here.
Follow our occasional Tweets @WinterCampers and visit us on Facebook.
SHARE
October 13th, 2013 | Category: Winter Camping
Comments are closed.


